Moving trends beginning in 2020 still have an impact
The COVID-19 pandemic that began in March 2020 significantly impacted almost every part of daily life. Americans experienced health, work, family, financial and school changes, which contributed to the decision to relocate for many people.1
The uptick in relocations ultimately led to changes in where and how people moved and how moving companies operated in the midst of market disruptions. U-Pack, a self-moving service, saw these changes in our moving reports. The migration trends provided below demonstrate our findings: changes in the number of people moving, shifts in popular origins/destinations, an increase in move size and the decreased use of moving labor.
More people moved during the pandemic than in previous years
The Wall Street Journal reported that in 2020, more than 7 million households relocated to a different county, which is almost half a million more households than in 2019.2 As a long-distance moving service, U-Pack saw similar trends with record-high levels of people considering a move that year (as illustrated by the number of quotes received year-over-year below). The moving industry typically peaks from May to September as families move over the summer. However, after an initial drop, we saw traffic levels climb early and continue throughout 2020 and 2021. The chart below shows daily moving quote levels, comparing numbers from 2019 (a typical business year) to 2020 and 2021.

The chart shows how quote data changed as key events took place throughout the early stages of the pandemic in 2020:
- January 20: The Centers for Disease Control announced the first lab-confirmed case of COVID-19 in Washington state3
- March 1- May 31: 42 states and territories issued mandatory stay-at-home orders4
- March 11: The World Health Organization declared COVID-19 a pandemic5
- March 13: Former President Donald Trump declared COVID-19 a national emergency and issued a travel ban from Europe
- March 26: The U.S. Senate passed the Coronavirus Aid, Relief, and Economic Security (CARES) Act, which provided relief for businesses, health care, state and local governments through grants and programs, and individual support through the first stimulus checks
- December 27: Former President Trump signed a $900 billion economic relief package, which led to the second stimulus checks6
As more people relocated, it became clear these moves were different from before. Certain destinations were more popular, moves were using more space and customers utilized less labor.
Where people moved to and from changed
U-Pack looked at our most requested origin/destination pairs in 2019 compared to 2020 and 2021. The chart below lists the top 20 sets of locations from each year.
U-Pack 20 Most Popular Origin/Destination Location Pairs
| 2019 |
|---|
| Portland, OR → Phoenix, AZ |
| Oakland, CA → Portland, OR |
| Denver, CO → Phoenix, AZ |
| San Bernardino, CA → Phoenix, AZ |
| Phoenix, AZ → Portland, OR |
| Minneapolis, MN → Phoenix, AZ |
| San Bernardino, CA → Portland, OR |
| Denver, CO → Portland, OR |
| Seattle, WA → Phoenix, AZ |
| Carlstadt, NJ → Pico Rivera, CA |
| Oakland, CA → Denver, CO |
| Phoenix, AZ → Denver, CO |
| Sacramento, CA → Portland, OR |
| Oakland, CA → Seattle, WA |
| Oakland, CA → Phoenix, AZ |
| Brooklyn, NY → Orlando, FL |
| San Diego, CA → Portland, OR |
| San Jose, CA → Portland, OR |
| Oakland, CA → Austin, TX |
| Houston, TX → Denver, CO |
| 2020 |
|---|
| Oakland, CA → Portland, OR |
| Portland, OR → Phoenix, AZ |
| Oakland, CA → Denver, CO |
| Denver, CO → Phoenix, AZ |
| Phoenix, AZ → Portland, OR |
| Oakland, CA → Seattle, WA |
| San Bernardino, CA → Phoenix, AZ |
| Seattle, WA → Phoenix, AZ |
| Oakland, CA → Austin, TX |
| Brooklyn, NY → Orlando, FL |
| Carlstadt, NJ → Pico Rivera, CA |
| Minneapolis, MN → Phoenix, AZ |
| Oakland, CA → Phoenix, AZ |
| Denver, CO → Portland, OR |
| San Jose, CA → Portland, OR |
| Phoenix, AZ → Denver, CO |
| Phoenix, AZ → Phoenix, AZ |
| San Bernardino, CA → Las Vegas, NV |
| San Bernardino, CA → Portland, OR |
| Pico Rivera, CA → Portland, OR |
| 2021 |
|---|
| Portland, OR → Phoenix, AZ |
| Oakland, CA → Portland, OR |
| Seattle, WA → Phoenix, AZ |
| Phoenix, AZ → Portland, OR |
| San Jose, CA → Austin, TX |
| Oakland, CA → Austin, TX |
| Oakland, CA → Seattle, WA |
| Oakland, CA → Denver, CO |
| Brooklyn, NY → Orlando, FL |
| Denver, CO → Phoenix, AZ |
| Oakland, CA → Phoenix, AZ |
| Portland, OR → Denver, CO |
| Phoenix, AZ → Denver, CO |
| Tacoma, WA → Phoenix, AZ |
| San Bernardino, CA → Dallas, TX |
| San Jose, CA → Seattle, WA |
| San Bernardino, CA → Phoenix, AZ |
| Oakland, CA → Carlstadt, NJ |
| Oakland, CA → Dallas, TX |
| Minneapolis, MN → Phoenix, AZ |
To help contextualize the changes in traffic, we determined the percentage of quotes these locations received compared to the total moves in this list. From 2019 through 2021, Phoenix remained the top destination city, however throughout the pandemic, we saw a higher percentage of people heading to places that were more affordable and had lower population densities overall. Moves from California continuously increased from 2019-2021.
2019
The top destinations were:
- Phoenix (35.2% of quotes from the top 20 locations)
- Portland (34.9%)
- Denver (13%)
The majority of outbound moves came from California (47.1%).
Note: Californian locations were grouped together because the population decline is often discussed statewide.
2020
This year traffic began to shift. The top 2020 destinations remained the same, but traffic levels changed.
The top destination cities saw a shift in percentages as people sought to move to less populated areas:
- Phoenix (36%)
- Portland (30.4%)
- Denver (10.1%)
2020 also saw the introduction of Las Vegas, NV onto the top destinations list. And lastly, we found an interesting anomaly for U-Pack, a long-distance moving service, with local Phoenix-to-Phoenix moves appearing on the list. While we wouldn’t service these moves due to our long-distance business model, customers could still request quotes (that were sent to market partners who performed local moves). The National Association of Realtors® found that Phoenix was the the third largest real estate market during the pandemic, and many buying and selling there were already local.7
In terms of origins, we saw an increase in those leaving California (52%) year-over-year.
2021
As the pandemic continued, we saw even more noticeable differences in where people moved. Since the trends we saw at the beginning of the pandemic were only amplified during 2021, we’ve included a map below that shows the changes. We believe the migration trends from this year best demonstrate the ways that the pandemic shifted the population.
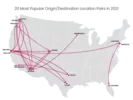
The top inbound locations were:
- Phoenix (36%)
- Denver (13.3%)
- Austin/Portland (tied at 12.9%)
We saw Dallas coming into the list in 2021, with 8% of our quoted moves heading there.
Finally, even more people were leaving California, with the overall percentage increasing from 2020 to 2021 (53.2%).
Lifestyle changes that made more people move from California
In trying to understand the data, we looked into potential explanations for these emerging trends. First, we found that U-Pack wasn’t alone in showing a majority of people moving from the West Coast. Similar findings were reported by Forbes8 and the U.S. News and World Report.9 But why did residents leave cities across the area? Several factors could have led people to move from California mid-pandemic, including:
- Flexible work situations: Flexible jobs platform Upwork found that 4.9 million Americans moved between 2020 and 2021 because of the ability to work remotely.10
- The need for a lower cost of living: Forbes® reported that high tax rates and rising housing costs made residents of California look for a new place to live.
Things that attracted people to the top inbound cities
Our most popular destinations during the pandemic were Phoenix, AZ; Portland, OR; Denver, CO; and Austin, TX. This aligned with what was seen industry-wide, as reported in Bloomberg’s report on “Where and Why Americans are Relocating.”11 Here’s what may have drawn people to these locations:
- Lower home prices: The University of Texas at Austin and Stanford’s Institute for Economic Policy Research studied specific migration from California to Texas and found that lower home prices were a huge draw for people moving from The Golden State to the Lone Star State.12
- Lower taxes: While Denver has a higher cost of living than some of the other top destinations, it has a lower income tax rate than California, 4.63% compared to 13.3%.13 Additionally, Texas has no state income tax.14
- Lower cost of living: Many origin-destination pairs had people moving to a place with a much lower cost of living index score — for example, the top lane in 2021 was Portland to Phoenix, and the cost of living in Phoenix is 10.7% lower than that of Portland.15
- Lower population density: The inbound cities of Denver and Phoenix have a lower population density than the corresponding outbound metros.16 For people looking for a little more breathing room, it may have been appealing to go somewhere with fewer residents per square mile.
The average move size started growing in 2020 and continued into 2021
During the pandemic, U-Pack shipment size trended upwards as people used more space than before to move their belongings. U-Pack utilizes two types of moving equipment: a 6’ x 7’ x 8’ ReloCube container and a 28’ moving trailer, and customers can use the space they need.
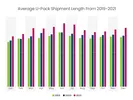
Starting in March 2020, we found that the average shipment size was higher every month than in 2019. Trends toward larger shipments continued throughout 2021. We believe that trend may be due to several factors:
- The inability to get rid of unwanted items. During the early stages of the pandemic, many thrift and consignment shops were closed around the country.17 Social distancing guidelines also made it complicated to hold garage or estate sales.18,19
- A shift to DIY moving. As people desired to keep a safe social distance during their move, those who normally would have used full-service movers may have shifted to a DIY option. Those types of customers typically have larger homes, possibly leading to an increase in shipment size for self-moves.
- Capacity constraints: To keep demand in line with our limited capacity while providing high-quality service, moves with larger shipments and longer distances had the most competitive pricing.
Moving crews were used less at the beginning of the pandemic
The year-over-year comparison of customers who hired moving labor with their U-Pack move changed dramatically in 2020, with more people opting to move themselves at the start of the pandemic.
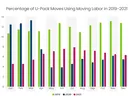
On average, in 2019, 8.4% of moves included added labor, compared to 4.6% in 2020. The changes in 2020 were likely due to two factors:
- Safety concerns. Medical experts encouraged people to move safely with as few risks as possible.20 They recommended that moving crews (or even friends helping) respect social distancing guidelines, wear masks and be screened for symptoms, which made do-it-yourself moving feel like a safer option. Since U-Pack is a self-moving service, no in-home estimate was required, so the only contact customers would have was with loading or unloading help. While the local moving crews we referred customers to followed health and safety mandates, it’s possible that many did not feel comfortable having strangers in their homes or handling their belongings.
- The need to move quickly. Pew Research found that the onset of the pandemic caused many people to move right away21, likely without time to schedule movers. Along with the initial wave of people who scheduled a move during the first month of the pandemic, the real estate boom meant many people were buying and selling homes quickly22, so perhaps they were planning to move promptly without waiting for availability with a moving crew.
While labor percentages began to rise again in 2021, they have not returned to pre-pandemic levels, likely due to customers opting to move themselves to save money as overall moving rates have increased in response to market demand.
Changes to U-Pack as a result of the pandemic
U-Pack is a service of ArcBest®, a leading logistics provider that performed essential services during the pandemic, including delivering goods and personal protective equipment (PPE) to cities across the country. Company-wide, we made adjustments to offer customers a safe and reliable moving option.
Contactless payments and deliveries
Pre-pandemic, our system was already set up for contactless payment over the phone or online. But because of health directives, we adjusted our policies on March 17, 2020 to provide a contactless delivery option, allowing people to take delivery of moving equipment without in-person contact or physical signatures.
Safety precautions
To protect customers, drivers were masked while dropping off equipment, and we worked with our labor network to ensure moving crews were following locally-mandated safety guidelines.
Information about other ways ArcBest responded to the pandemic can be found in our 2020 Environmental, Social and Governance Report.
How U-Pack will continue to adapt for the future
The moving market is still stressed because of the continued desire for relocation paired with supply chain disruptions. However, our self-moving service positions us to meet the market challenges with unique solutions. Our transportation partner, ABF Freight, and their network of service centers make it easier for us to get empty equipment from popular destinations than companies that rely on customers to transport equipment, like truck rental.
Due to labor shortages, limited capacity and increased fuel costs, moving prices industry-wide remained higher than usual continuing into 2022.23 To meet the increased demand, we have ordered more equipment to serve more customers, and we continue making technology improvements and growing our team. While these unprecented times brought challenges, we will continue to adapt and grow for whatever the future brings.
U-Pack and ArcBest are registered trademarks of ArcBest IP Holdings, LLC. The use herein of third-party trademarks or registered trademarks does not imply any affiliation with or endorsement of such third-party.
1 https://www.pewresearch.org/fact-tank/2020/07/06/about-a-fifth-of-u-s-adults-moved-due-to-covid-19-or-know-someone-who-did/
2 https://www.wsj.com/articles/americans-up-and-moved-during-the-pandemic-heres-where-they-went-11620734566
3 https://www.cdc.gov/museum/timeline/covid19.html
4 https://www.cdc.gov/mmwr/volumes/69/wr/mm6935a2.htm
5 https://www.who.int/director-general/speeches/detail/who-director-general-s-opening-remarks-at-the-media-briefing-on-covid-19---11-march-2020
6 https://www.congress.gov/bill/116th-congress/house-bill/133/all-actions?overview=closed#tabs
7 https://cdn.nar.realtor/sites/default/files/documents/top-ten-markets-during-and-in-a-post-covid-environment-in-2021-2022-12-14-2020.pdf
8 https://www.forbes.com/home-improvement/features/states-move-to-from/#states_people_are_leaving_section
9 https://www.usnews.com/news/best-states/articles/2021-01-04/americans-moved-west-and-south-in-2020-amid-coronavirus-pandemic-study-finds
10 https://www.upwork.com/research/new-geography-of-remote-work
11 https://www.bloomberg.com/news/articles/2020-12-14/best-us-cities-to-move-to-during-covid-where-and-why-americans-are-relocating
12 https://siepr.stanford.edu/research/publications/tale-two-states-contrasting-economic-policy-california-and-texas
13 https://www.denverpost.com/2020/12/16/denver-most-moved-to-cities-covid-pandemic/
14 https://taxfoundation.org/publications/state-individual-income-tax-rates-and-brackets/
15 https://www.salary.com/research/cost-of-living/compare/portland-or/phoenix-az
16 https://www.census.gov/data.html
17 https://www.today.com/style/can-you-donate-clothes-during-coronavirus-pandemic-what-you-need-t177980
18 https://www.starbeacon.com/news/coronavirus/covid-19-checklist-for-garage-sales/article_d4177874-3d41-5df4-a8db-f7fe3a176993.html 19 https://www.kltv.com/2020/05/14/during-covid-outbreak-are-garage-sales-allowed/
20 https://www.bustle.com/wellness/how-to-move-safely-covid-doctors
21 https://www.pewtrusts.org/en/research-and-analysis/blogs/stateline/2022/03/23/the-pandemic-prompted-people-to-move-but-many-didnt-go-far
22 https://www.wsj.com/articles/homes-typically-sell-in-a-week-forcing-buyers-to-take-risks-11636632000
23 https://www.forbes.com/home-improvement/moving-home/top-moving-trends-2022/